
Shetland Heat Energy and Power (SHEAP, district heating)

Invoicing Automation
Problem
Shetland Heat Energy and Power provide district heating to a number of properties throughout Lerwick, with readings supplied back to a central system in the office.
However this system doesn't integrate with Sage, meaning staff had to spend time calculating usage and raising invoices individually for a large number of customers.
Solution
A custom application was developed to bridge the gap, integrating with the meter reading system Kamstrup and Sage. It obtains reading data from the system and calculates usage from the last billed and latest readings, adds additional required charges, then creates a list of proposed invoices for customers.
Staff then check through these invoices, and can easily identify abnormally high readings highlighted in red that may indicate equipment failure. Once satisified, clicking a button produces 100s of invoices in Sage in minutes that are ready to print and send to customers.
This is a great time saver for staff, shortening a process that previously took weeks every quarter.
Other features of the application also allow staff to browse, group, and find information quickly and easily.
Further admin efficiencies and statistical reports are also being looked into.
Automatic Customer Statements
A system was developed to automatically create annual statements for all customers in a couple of clicks.
The software works out whether each customer's usage meets their current monthly tarriff by cross referencing entries in Sage and looking at usage data. If required, either a new monthly tarriff is calculated (decrease/increase), or they are left on the existing. Refunds are also worked out. These details are then placed in the bulk generated statements, which are created for hundreds of customers in seconds! This saves a lot of staff time, since they no longer have to work out figures or produce the statements indivvidually.
Statistics
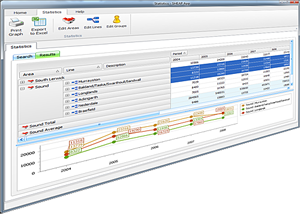
This system was developed to provide detailed analysis of consumption usage over Lerwick using meter reading data that has been collected over the years, and it produces a variety of statistics and graphs.
Data can be drilled down by area, street and individual property to get totals, averages, and compare usage trends over different time periods.
The powerful tool is flexible and can give some very useful insights into seasonal or like-for-like property trends. It can also answer customers queries like "Is my usage higher than average?" very easily.
By selecting a variety of cells, instant realtime graphing occurs underneath for the selected data, making producing graphs easy. Data or graphs can be printed or exported to Excel for further processing.